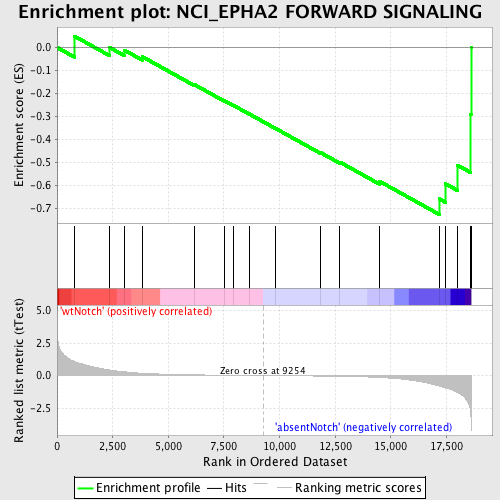
Profile of the Running ES Score & Positions of GeneSet Members on the Rank Ordered List
| Dataset | Set_03_absentNotch_versus_wtNotch.phenotype_absentNotch_versus_wtNotch.cls #wtNotch_versus_absentNotch |
| Phenotype | phenotype_absentNotch_versus_wtNotch.cls#wtNotch_versus_absentNotch |
| Upregulated in class | absentNotch |
| GeneSet | NCI_EPHA2 FORWARD SIGNALING |
| Enrichment Score (ES) | -0.7267541 |
| Normalized Enrichment Score (NES) | -1.4943527 |
| Nominal p-value | 0.030120483 |
| FDR q-value | 0.6766587 |
| FWER p-Value | 1.0 |
| PROBE | DESCRIPTION (from dataset) | GENE SYMBOL | GENE_TITLE | RANK IN GENE LIST | RANK METRIC SCORE | RUNNING ES | CORE ENRICHMENT | |
|---|---|---|---|---|---|---|---|---|
| 1 | INPPL1 | 110717 3120164 | 776 | 1.083 | 0.0494 | No | ||
| 2 | VAV2 | 3610725 5890717 | 2371 | 0.421 | -0.0009 | No | ||
| 3 | RHOA | 580142 5900131 5340450 | 3010 | 0.287 | -0.0111 | No | ||
| 4 | EPHA2 | 5890056 | 3828 | 0.177 | -0.0401 | No | ||
| 5 | PIK3CA | 6220129 | 6193 | 0.053 | -0.1627 | No | ||
| 6 | SRC | 580132 | 7508 | 0.026 | -0.2312 | No | ||
| 7 | ACP1 | 1990435 | 7931 | 0.019 | -0.2523 | No | ||
| 8 | PIK3R1 | 4730671 | 8630 | 0.008 | -0.2891 | No | ||
| 9 | EFNA1 | 3840672 | 9824 | -0.008 | -0.3526 | No | ||
| 10 | BCAR1 | 1340215 | 11859 | -0.041 | -0.4585 | No | ||
| 11 | PAK1 | 4540315 | 12714 | -0.061 | -0.4992 | No | ||
| 12 | VAV3 | 1050731 2450242 2680653 | 14503 | -0.148 | -0.5829 | No | ||
| 13 | RAC1 | 4810687 | 17179 | -0.806 | -0.6590 | Yes | ||
| 14 | GRB2 | 6650398 | 17463 | -0.960 | -0.5935 | Yes | ||
| 15 | CBL | 6380068 | 18007 | -1.306 | -0.5128 | Yes | ||
| 16 | PTK2 | 1780148 | 18588 | -3.004 | -0.2914 | Yes | ||
| 17 | TIAM1 | 5420288 | 18608 | -3.482 | 0.0004 | Yes |

